
Chapter 9 of 10: Written by Christian Harpelund
From diagnosis to action: How to build a catalog that matches the data
This is the ninth article in a series about understanding and improving organizations’ ability to onboard new employees.
Summary (TL;DR)
Onboarding data only creates value when it leads to concrete action. That means matching interventions to both the dimension where the challenge appears and the point in the employee journey where support is needed.
In this blog post, you’ll learn:
- Why a low onboarding score does not tell you what action to take
- How a catalog can connect data to concrete onboarding interventions
- Why timing matters when choosing the right intervention
In short, when data and interventions are connected, it becomes easier to prioritize the right areas and strengthen onboarding where the need is greatest.
One combined score. Six very different signals
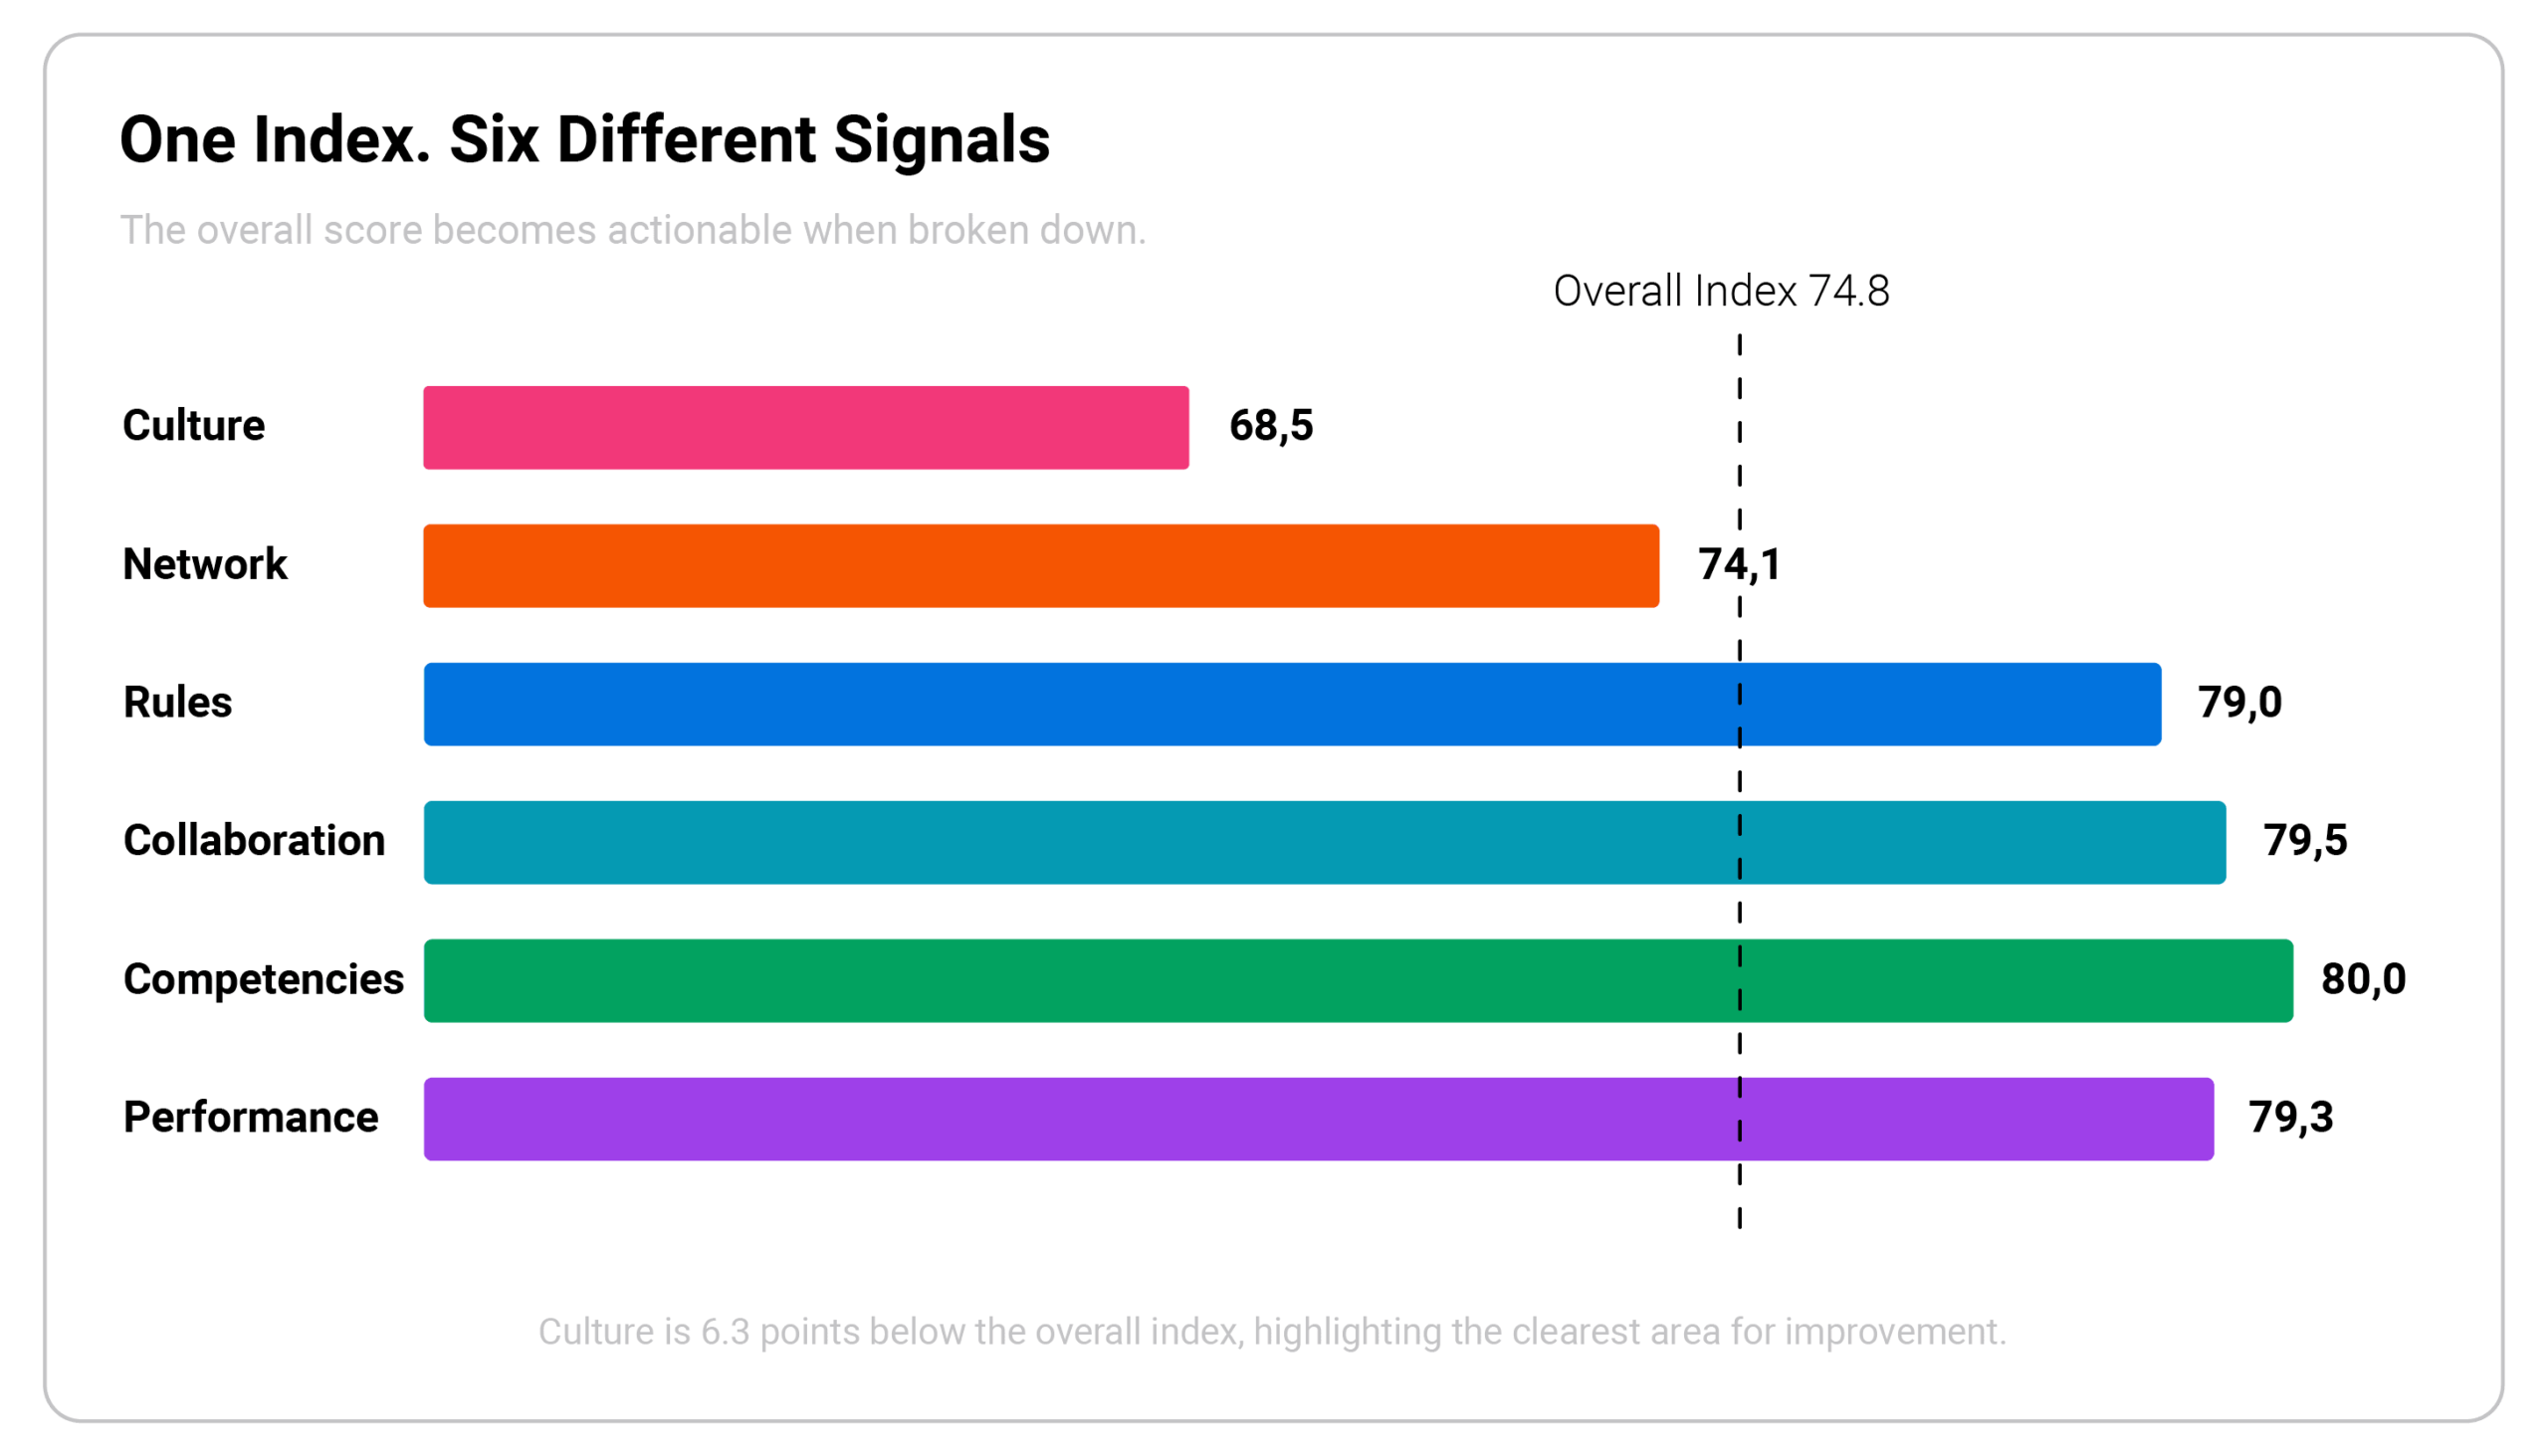
An organization looks at its combined index: 74.8. Decent, not exceptional. But break the number down across the six dimensions, and the picture turns out to be far more uneven than the combined score suggests. Rules, Collaboration, Competencies, and Results all sit solidly above average, ranging from 79 to 80. Network sits just below, at 74.1. And Culture sits at the lowest level, at 68.5 — six points below the combined index.
Now the organization knows where the problem sits. But what do you actually do about it?
If you’ve ever sat with a dimension score like that Culture number and genuinely not known what to do next beyond ‘we should work on this,’ you’re not alone — and that gap between seeing the number and acting on it is exactly what this article is about.
You’re reading a chapter in our new blog series on understanding and improving organizations’ ability to onboard new employees.
You are currently reading:
Chapter 9: From diagnosis to action: How to build a catalog that matches the data
Read also:
Chapter 1: Most organizations ask about satisfaction. That’s the wrong question
Chapter 2: Six dimensions, one model: What good onboarding actually looks like
Chapter 3: From data to dialogue: What a dialogue report can do for your onboarding
Chapter 4: The index: How we track progress – and benchmark against others
Chapter 5: What benchmarks tell us about onboarding across age groups
Chapter 6: Six dimensions, six signals: What does a high or low score actually mean?
Chapter 7: The onboarding curve: The experience doesn’t just improve over time
Chapter 8: The onboarding calendar: Does it matter what time of year you hire?
Chapter 10: From data to prediction: What AI can do for onboarding
A diagnosis isn’t a treatment
This is a trap many organizations fall into at this point: they see the low score, conclude ‘we need to strengthen culture in onboarding’ — and rush out and do something vague that isn’t tied to anything specific. A single presentation on the company’s history. A poster with the values on the wall. That rarely solves the problem, because it isn’t an intervention matched to what the data is actually pointing at.
THE MISSING LINK
A catalog of concrete interventions, organized around the exact same six dimensions you measure on.
A catalog of concrete interventions, organized around the exact same six dimensions you measure on.
What a catalog actually looks like
A catalog of this kind is organized in two ways at once. First, by dimension — each intervention is tagged to the dimension or dimensions it supports: Competencies, Network, Culture, Results, Collaboration, Rules. Second, by where it belongs in the employee journey — preboarding, onboarding, reboarding (when someone changes role internally), crossboarding, and offboarding.
1 DIMENSION
Competencies · Network · Culture · Results · Collaboration · Rules
2 PHASE
Preboarding · Onboarding · Reboarding · Crossboarding · Offboarding
EXAMPLES FROM THE CATALOG
NETWORK
Virtual handshakes
Map your network
The professional network
The social committee
CULTURE
Our values
The unwritten rules
Strategy coffee
Our rhythms and rituals
The point isn’t that every organization should use exactly these interventions. It’s that when data points to a weak dimension, the answer shouldn’t be a random idea — it should be a set of tested interventions you can choose from, depending on what fits your organization.
Back to the example
For the organization with the 74.8 index, that plays out concretely: the low Culture score (68.5) points toward the culture catalog — perhaps “Our values” early in the preboarding phase, combined with “Our rhythms and rituals” in the first weeks of onboarding. The slightly lower Network score (74.1) points to the need for network interventions, such as “Map your network” and a structured buddy program.
What you don’t need to touch matters just as much as what you act on. Rules, Collaboration, Competencies, and Results are already solid — spending resources to improve them further would be a waste compared to turning attention to the two dimensions that are actually dragging the score down.
PRIORITIZE UNEVENLY
What you don’t need to touch matters just as much as what you act on.
What you don’t need to touch matters just as much as what you act on.
Why “when” still matters
The catalog shouldn’t only match dimension — it also needs to match timing. As we’ve seen in earlier articles in this series, onboarding isn’t a smooth process: the experience dips and rises over time, and it varies depending on what time of year you hire. That means the same dimension can call for different interventions depending on whether you’re in the preboarding phase, in the middle of the first dip a couple of months in, or in a period when the organization is already under pressure.
PREBOARDING
Create direction and access before day one.
THE FIRST DIP
Restart structure, relationships, and follow-up.
A BUSY PERIOD
Use robust interventions that depend less on specific people.
PRECISION IN TWO DIMENSIONS
Adjust not just what you do — but also when you do it.
Adjust not just what you do — but also when you do it.
If you’re managing onboarding across teams that don’t all run on the same calendar, this is where the catalog earns its keep: the same underlying diagnosis (a weak Culture score, say) can call for a very different intervention depending on whether the team in question is heading into its busiest quarter or has room to breathe.
From a single fix to a system
The real potential only shows up once you have more than one possible intervention per dimension. If you have only one solution for a low Culture score, you apply it to everyone. If you have several to choose from, you can differentiate between an informal “fun facts” exercise for a more casual culture and a more structured values program for a more complex culture to navigate.
This is where the earlier articles in the series connect. The age groups that respond differently (article 5). The seasonal variation that calls for different approaches at different times of year (article 8). The dimensions, each with its own signal (article 6). A catalog is the tool that makes it possible to act on all of that insight at once, instead of trying to remember it case by case.
From catalog to prediction
A catalog solves the problem of what to do once data shows a weakness. But it raises one last natural question: can the same data be used to predict where weaknesses will emerge before they show up in a score, for the individual employee and for the organization as a whole? That’s the subject of the final article in the series.
Before you read the next chapter, you can learn more here about how FastTrack can enhance your onboarding processes. FastTrack is part of HR-ON Onboarding.
THE CRUCIAL SHIFT
Move from a diagnosis that describes the problem to a system of interventions that matches both signal and situation.
Move from a diagnosis that describes the problem to a system of interventions that matches both signal and situation.
This is the ninth article in a series about measuring and improving onboarding.
About the author
- Christian Harpelund is a qualified organizational psychologist and works with HR-ON as an onboarding expert
- He is the author of “Onboarding: Getting New Hires off to a Flying Start” and has a new book coming soon, “Kunsten at onboarde en leder” (in Danish)
- He delivers courses and gives talks on onboarding and the organizational frameworks that support effective leadership
How can onboarding data be turned into concrete action?
What does onboarding data tell you?
Onboarding data helps identify where challenges are occurring. By breaking the overall score down into dimensions such as Culture, Network, Competencies, Results, Collaboration, and Rules, organizations can see which areas need the most attention.
Why is a low onboarding score not enough on its own?
A low score shows that something needs attention, but it does not explain which action will have the greatest effect. To move from diagnosis to action, organizations need interventions directly linked to the specific dimension in which the challenge appears.
What is an onboarding intervention catalog?
An onboarding intervention catalog is a structured collection of activities linked to both specific onboarding dimensions and different phases of the employee journey. It makes it easier to choose an intervention that matches the challenge identified in the data.
Why does timing matter when choosing an onboarding intervention?
The same challenge can require different actions depending on when it occurs. An intervention that works well during preboarding may not be the right choice during a busy period or a few months into onboarding. Matching the intervention to both the challenge and the timing makes the effort more relevant.