
Chapter 5 of 10: Written by Christian Harpelund
What benchmarks tell us about onboarding across age groups
This is the fifth article in a series about understanding and improving organizations’ ability to onboard new employees.
Short summary (TL;DR)
Age does play a role in onboarding, but less than many organizations might think. Benchmark data show that differences between age groups are often closely linked to how well the organization itself meets employees’ needs.
In this blog post, you will learn:
- Why employees over the age of 50 often have the most consistent onboarding experience
- Why do employees aged 30 to 40 face greater challenges in several industries, but not everywhere
- Why do onboarding experiences among the youngest employees vary the most from one organization to another
- How benchmarks can be used to challenge assumptions and identify small, targeted improvements to the onboarding process
In short, if you want to understand differences in onboarding across age groups, age alone will not give you the full picture. You also need to look at how your organization’s onboarding meets the needs of different employees and use data to identify where small adjustments can make a real difference.
The assumption about young employees only partly holds up
Most organizations carry a quiet assumption about who’s hardest to onboard: young employees. New to the workforce, unfamiliar with office life, needing more hand-holding. It sounds logical. It’s also only partly true — and in some organizations, flat-out wrong.
Looking at our benchmark data by age group, a picture emerges that’s far more nuanced than that assumption. A note before we go further: when this article talks about being “harder” to onboard, it isn’t about anyone being more difficult than anyone else. “Harder” here means the fine art of matching expectations, managing transitions, and creating the kind of experience that good onboarding is actually about.
If you work with onboarding day-to-day, you’ve probably already sensed that the “young employees are hardest” story is too simplistic. What the data adds isn’t a new intuition — it’s a way of seeing exactly where that intuition holds, and where it doesn’t.
50+
MOST STABLE
Consistently easiest to onboard.
30–40
INDUSTRY-DEPENDENT
Often hardest — but not everywhere.
THE YOUNGEST
MOST VARIATION
Swings the most between organizations.
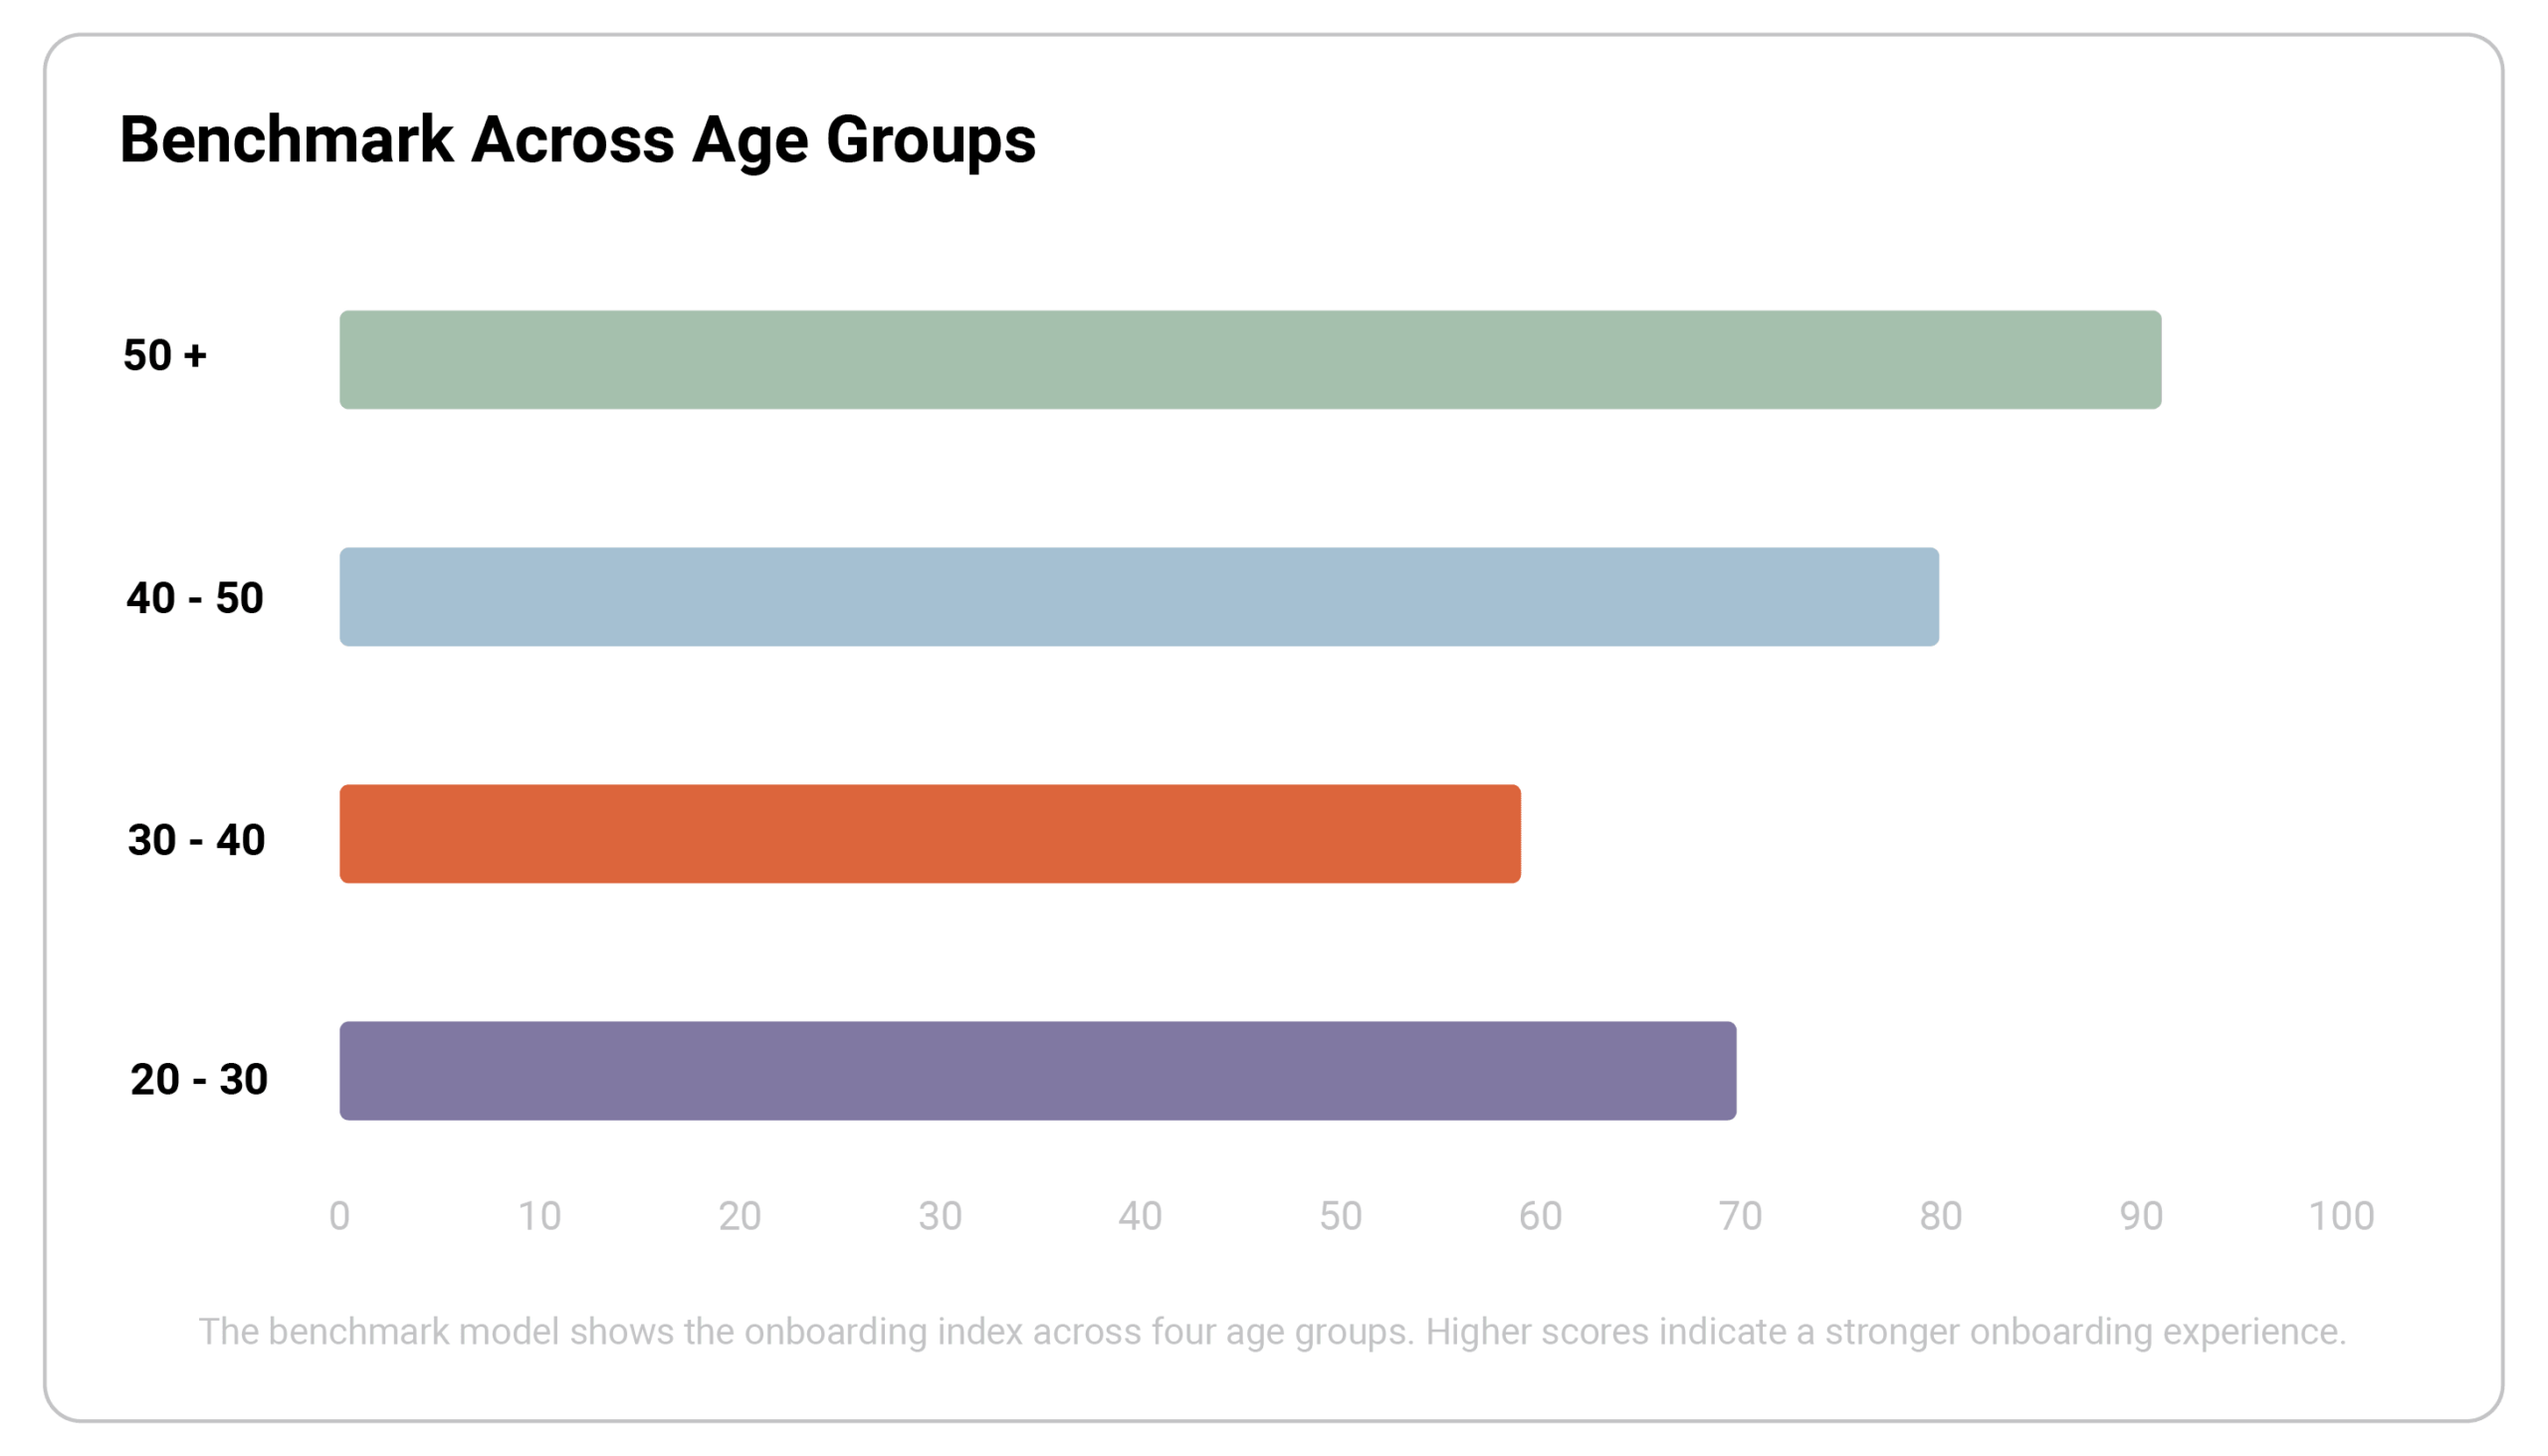
The benchmark model shows the onboarding index for four age groups. A higher score indicates a stronger onboarding experience.
You’re reading a chapter in our new blog series on understanding and improving organizations’ ability to onboard new employees.
You are currently reading: Chapter 5: What benchmarks tell us about onboarding across age groups
Read also:
Chapter 1: Most organizations ask about satisfaction. That’s the wrong question
Chapter 2: Six dimensions, one model: What good onboarding actually looks like
Chapter 3: From data to dialogue: What a dialogue report can do for your onboarding
Chapter 4: The index: How we track progress – and benchmark against others – Coming soon
Chapter 6: Six dimensions, six signals: What does a high or low score actually mean? – Coming soon
Chapter 7: The onboarding curve: The experience doesn’t just improve over time – Coming soon
Chapter 8: The onboarding calendar: Does it matter what time of year you hire? – Coming soon
Chapter 9: From diagnosis to action: How to build a catalog that matches the data – Coming soon
Chapter 10: From data to prediction: What AI can do for onboarding – Coming soon
50+ is consistently easiest to onboard
The most stable pattern in the data is this: employees over 50 are, across the board, the easiest to onboard. That holds across most of the organizations and industries we’ve measured.
It’s worth pausing on, because it runs counter to another common assumption — that older employees struggle more with change, new systems, and new cultures. The data points the other way. One possible explanation is that this group has typically experienced more job changes, and so has a more realistic picture of what the first few months of a new job actually involve. Another possible explanation is that they’re more likely to actively seek out the knowledge and relationships they need, rather than waiting for the organization to hand them over.
We don’t know for certain – but the pattern is clear enough to be worth investigating further.
30-40 is often hardest – but it depends on the industry
The next pattern is less clear-cut but still notable: in several industries, the 30–40 age group generally struggles most with onboarding.
A couple of hypotheses are worth keeping in mind here. This age group has often progressed further in their careers, and so carries higher expectations for what a new job should deliver — in terms of responsibility, influence, and pace. When expectations are high, there’s also more room for disappointment if the onboarding doesn’t meet them. A second hypothesis is about life stage: 30–40-year-olds are often balancing a new job with other major commitments — children, family, a life that’s already full — which leaves less capacity to navigate a new workplace’s unwritten rules and new networks on top of everything else.
THE IMPORTANT CAVEAT
The pattern varies by industry. It points to the interplay between age and industry expectations — not to age alone.
The youngest swing the most
The third pattern is the one that breaks most sharply with a common assumption. The youngest employees aren’t consistently the hardest or the easiest to onboard. They swing more than any other age group — from organization to organization.
In some organizations, young employees are the easiest group to onboard. In others, they’re the hardest — even surpassing the oldest employees in how challenging their onboarding is.
That’s a finding that points away from age as the explanation, and toward the organization itself. If an age group scores consistently across different workplaces, that suggests something inherent to the group. If that same age group swings dramatically from place to place, it instead suggests that the organization itself plays a decisive role in whether onboarding succeeds for that particular group.
It isn’t young employees who are hard or easy to onboard. It’s the organization’s ability to meet them where they are that varies.
What you can actually do about it
For those of you managing onboarding across different teams or business units, this is probably the most actionable of the three findings: it means the variation you might already be seeing between departments or offices isn’t noise. It’s a signal about where onboarding design itself needs attention.
None of these three findings should be read as the final word. They’re hypotheses the data points to — not definitive explanations. But they’re useful, because they shift the conversation from a broad assumption (“young employees are hardest”) to a more precise question: why are we seeing this particular pattern in our organization, and what does it tell us about where onboarding needs strengthening?
That doesn’t have to mean building three entirely different onboarding tracks for three different age groups. Few organizations have the resources for that, and it’s rarely necessary. But it can mean starting to differentiate onboarding in small ways, exactly where the patterns point.
THE YOUNGEST
Check whether the digital elements — system access and digital introduction to culture and process — are strong enough.
50+
Make room for this group to actively bring their own experience and networks into the onboarding design.
30–40
Look for one small extra touch of attention, or one activity, that addresses life balance — without redesigning the whole journey.
These are the kinds of adjustments benchmarks genuinely make possible: not large, costly overhauls, but precise, small shifts in where you place your attention.
More data, the same six dimensions
Age groups are just one data cut. The same question — where do the patterns differentiate, and what can we do about it — applies just as much when you look across the six dimensions in the model itself. Where are the systematic differences there, and what do they tell us about onboarding design? That’s the subject of the next article in the series.
Before you move on, take a look at what our FastTrack tool can do for you when it comes to onboarding. FastTrack is part of HR-ON Boarding+.
THE CRUCIAL SHIFT
Move from broad assumptions about age to precise questions about what the organization itself can change.
Move from broad assumptions about age to precise questions about what the organization itself can change.
About the author
- Christian Harpelund is a qualified organizational psychologist and works with HR-ON as an onboarding expert
- He is the author of “Onboarding: Getting New Hires off to a Flying Start” and has a new book coming soon, “Kunsten at onboarde en leder” (in Danish)
- He delivers courses and gives talks on onboarding and the organizational frameworks that support effective leadership
FAQ: What does onboarding age data tell us about different employee groups?
Does onboarding age affect how easy it is to onboard employees?
Yes, but age alone does not explain the differences. Benchmark data suggest that organizational context and industry also play an important role.
Which onboarding age group is easiest to onboard?
Employees aged 50+ are the most consistently easy to onboard across the organizations and industries measured.
Are younger employees harder to onboard?
Not consistently. Younger employees show the greatest variation, which suggests that the organization’s onboarding approach may matter more than age itself.
Why can employees aged 30–40 be more challenging to onboard?
In several industries, this age group appears to face greater onboarding challenges, potentially due to higher expectations and competing life commitments.
How should organizations adapt onboarding across age groups?
Rather than creating separate onboarding programs for each age group, organizations can make small, targeted adjustments based on patterns in their data.