
Chapter 4 of 10: Written by Christian Harpelund
The index: How we track progress — and benchmark against others
Fourth article in a series about understanding and improving organizations’ ability to onboard new employees.
Short summary (TL;DR)
Individual onboarding measurements can show how one employee is doing at a specific point in time – but they do not show whether the organisation’s onboarding is improving overall over time.
In this blog post, you will learn:
- how an onboarding index combines individual measurements into one overall picture
- why both the overall index score and the six underlying dimensions are important
- how measurements after 1, 3 and 6 months make it possible to track development and impact
- how benchmarking internally, against the industry and against the wider market puts the numbers into perspective
In short: An index makes it possible to move from isolated snapshots to a clear direction – and see whether onboarding is improving, what is driving the development, and how the organisation compares with others.
From snapshots to one direction
An HR manager has twenty dialogue reports on hand. Each one makes good sense on its own — a manager and an employee who’ve had a concrete conversation about their specific challenges. But ask the question ‘is our onboarding getting better?’, and twenty individual reports aren’t the answer. They show twenty snapshots. They don’t show a direction.
That’s the problem an index is built to solve
You’re reading a chapter in our new blog series on understanding and improving organizations’ ability to onboard new employees.
You are currently reading: Chapter 4: The index: How we track progress – and benchmark against others – Coming soon
Read also:
Chapter 1: Most organizations ask about satisfaction. That’s the wrong question
Chapter 2: Six dimensions, one model: What good onboarding actually looks like
Chapter 3: From data to dialogue: What a dialogue report can do for your onboarding
Chapter 5: What benchmarks tell us about onboarding across age groups – Coming soon
Chapter 6: Six dimensions, six signals: What does a high or low score actually mean? – Coming soon
Chapter 7: The onboarding curve: The experience doesn’t just improve over time – Coming soon
Chapter 8: The onboarding calendar: Does it matter what time of year you hire? – Coming soon
Chapter 9: From diagnosis to action: How to build a catalog that matches the data – Coming soon
Chapter 10: From data to prediction: What AI can do for onboarding – Coming soon
From individual measurements to one combined picture
A dialogue report is designed for a single conversation, at a single point in time, for a single employee. That’s exactly what makes it useful in that context — but it’s also what makes it insufficient once the question shifts from ‘how is this employee doing right now?’ to ‘how is our onboarding doing, overall, over time?’
An index brings together data from all the dialogue reports — across employees, departments, and the three measurement points (1, 3, and 6 months) — into a single metric you can follow over time. It exists on two levels at once: one combined index score showing the overall trend, and six underlying scores, one per dimension, that can each be followed individually.
ONE COMBINED INDEX SCORE
The overall trend. Easy to communicate with leadership and track quarter over quarter.
SIX DIMENSION SCORES
Shows what’s driving the trend — and reveals the dimension a decent average might otherwise hide.
This is an important detail. A combined score is easy to communicate — it’s what you show to your management, and what you track quarter over quarter. But it can also hide as much as it reveals: an organization can have a decent combined index while one particular dimension lags significantly, masked by the other five doing well. That’s why the six underlying scores aren’t redundant. They’re where you find out what’s actually driving the trend — up or down.
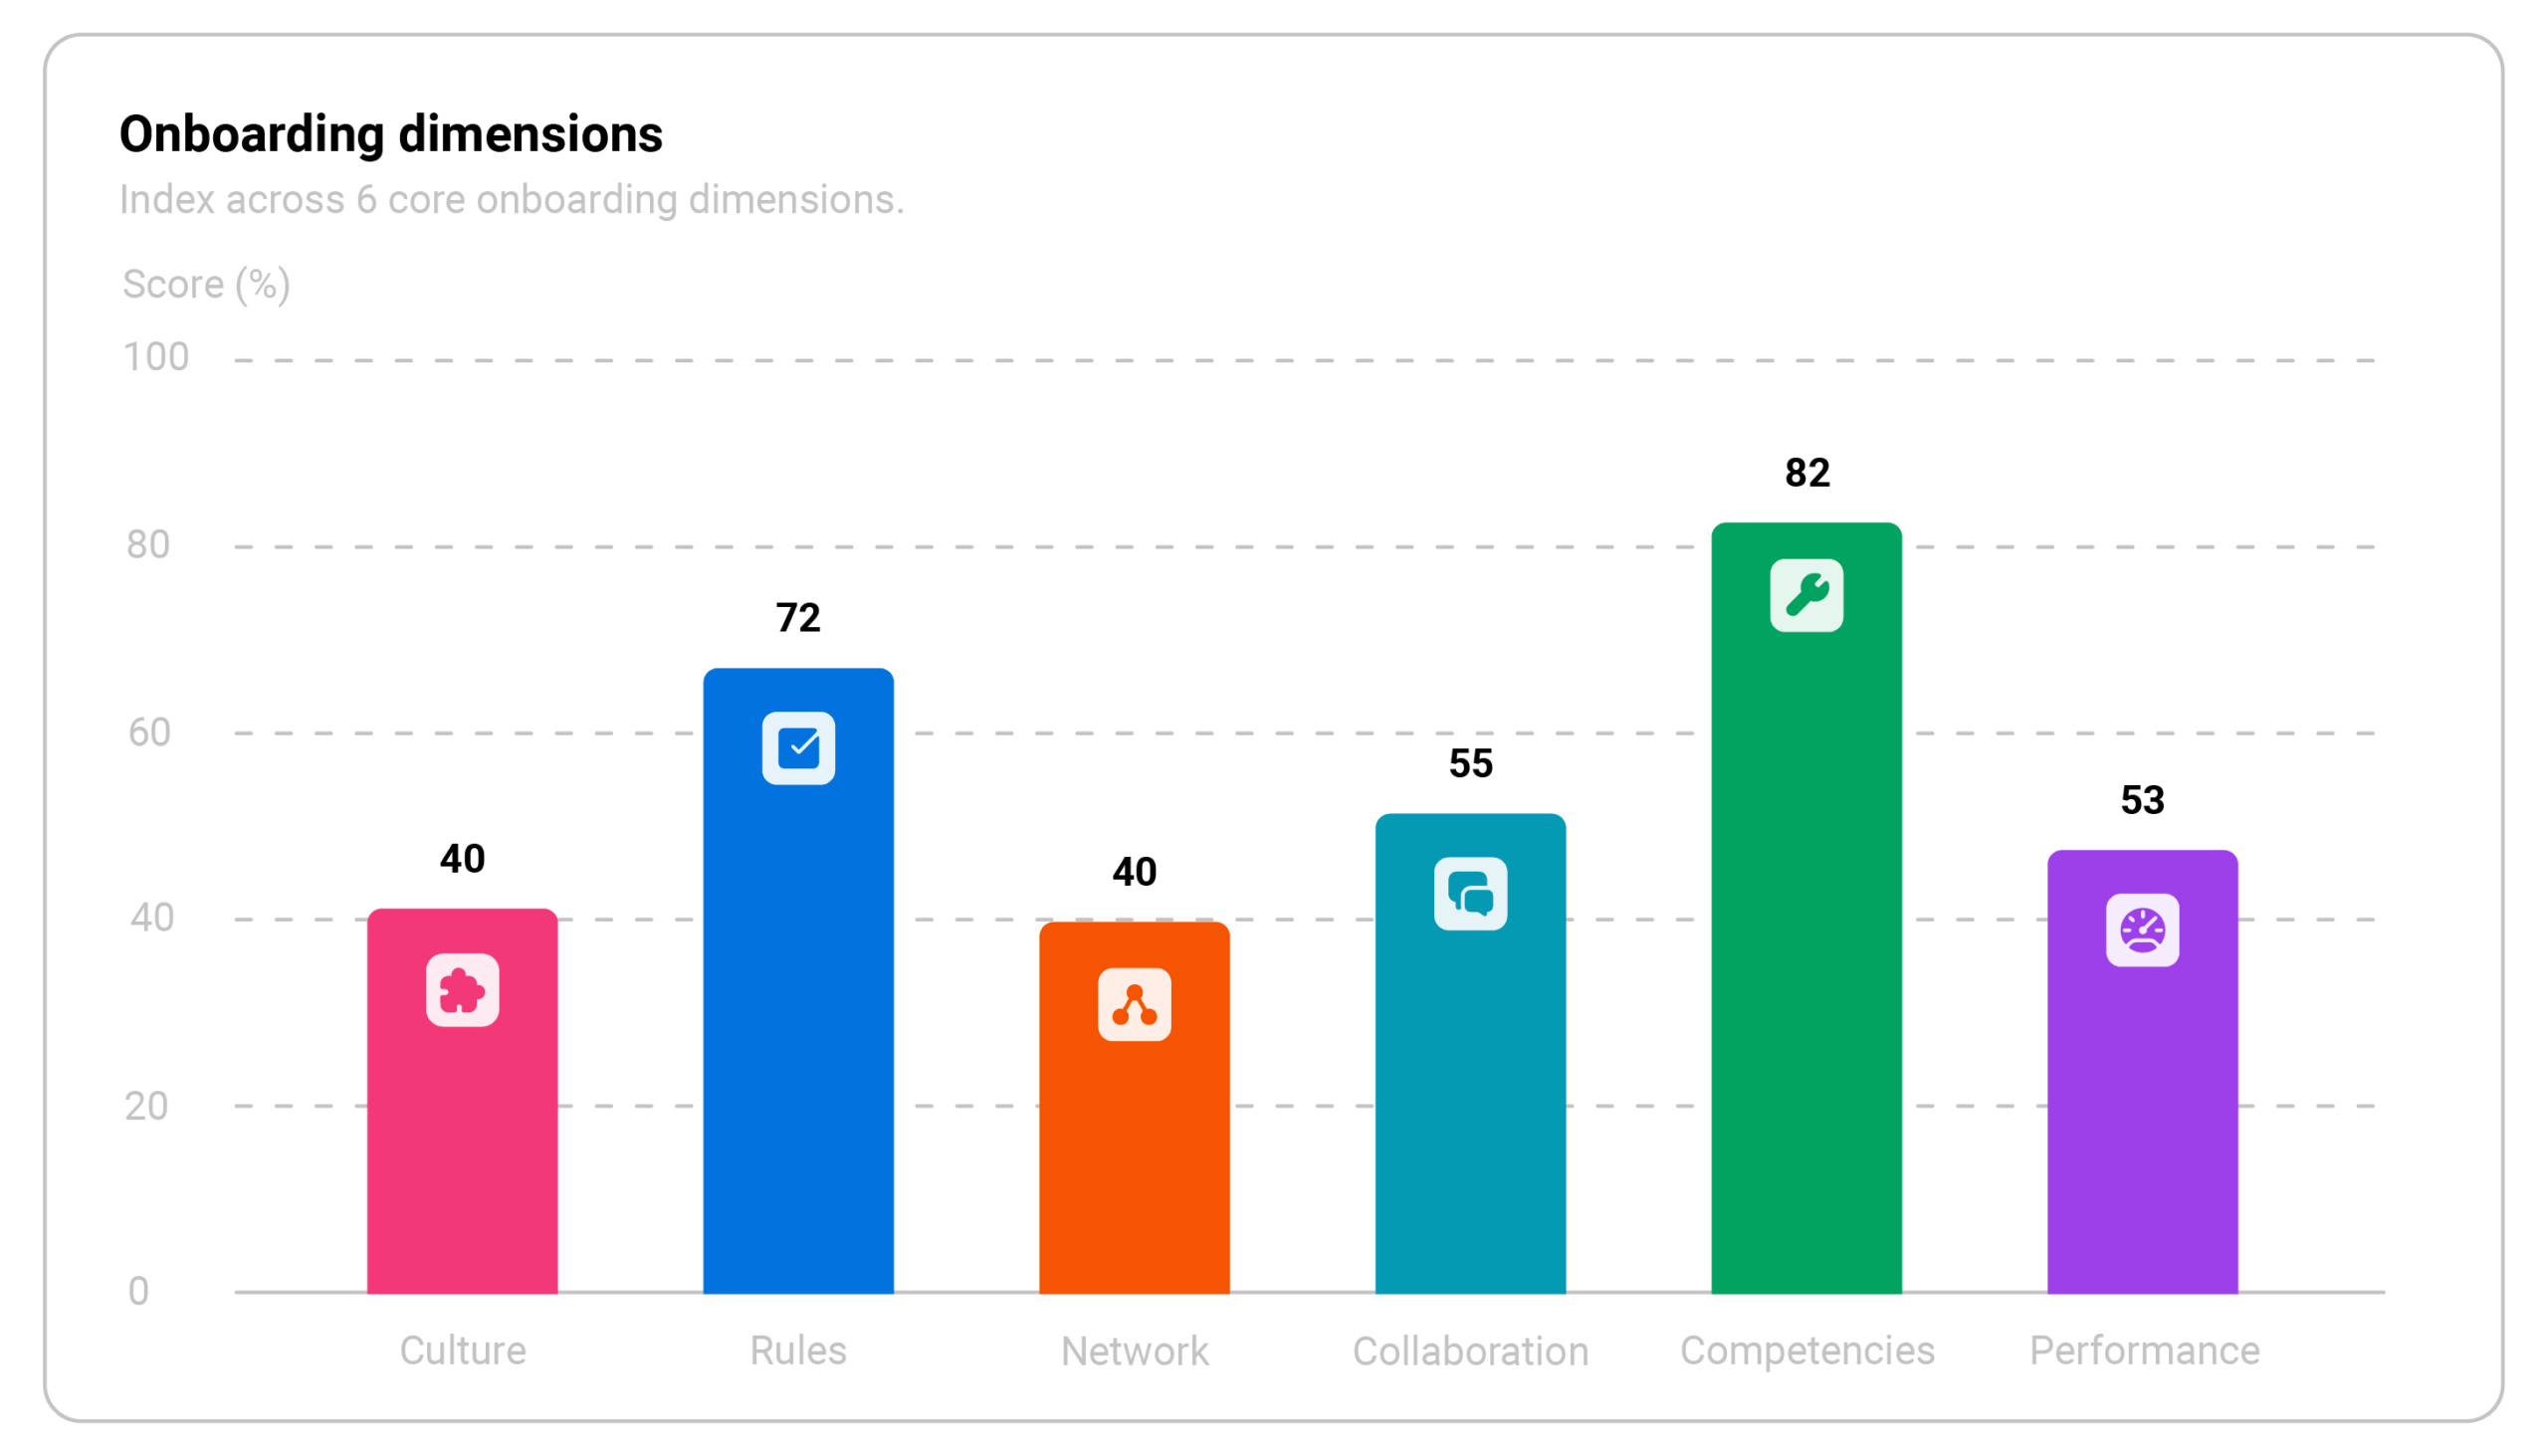
Example: The combined index can be broken down into the six onboarding dimensions, showing what’s driving the result.
How the index is used to track progress
Because data is collected after 1, 3, and 6 months, you can follow how the index moves for an individual employee throughout the process — does the culture dimension score rise from month 1 to month 3, or does it stay flat? But the real strength shows up when you aggregate across the board: following the index for all employees who started in the first quarter lets you see whether the organization’s onboarding is generally improving, year over year or quarter over quarter.
1 MONTH
First reading
An early read on the experience.
3 MONTHS
The trajectory
What’s moving — and what’s standing still?
6 MONTHS
The impact
Has the effort made a lasting difference?
That makes the index something different from a report — it’s a time series. You can see whether an initiative launched six months ago, say, a new mentoring program aimed at strengthening the network dimension, has actually moved the numbers. Without that kind of tracking, it’s impossible to know whether your improvement efforts are working, or whether you’re just hoping they are.
How the index is used to benchmark
Progress is relative. A rising index score is good news — but it doesn’t say anything about whether you’re ahead of or behind others. That’s where benchmarking comes in.
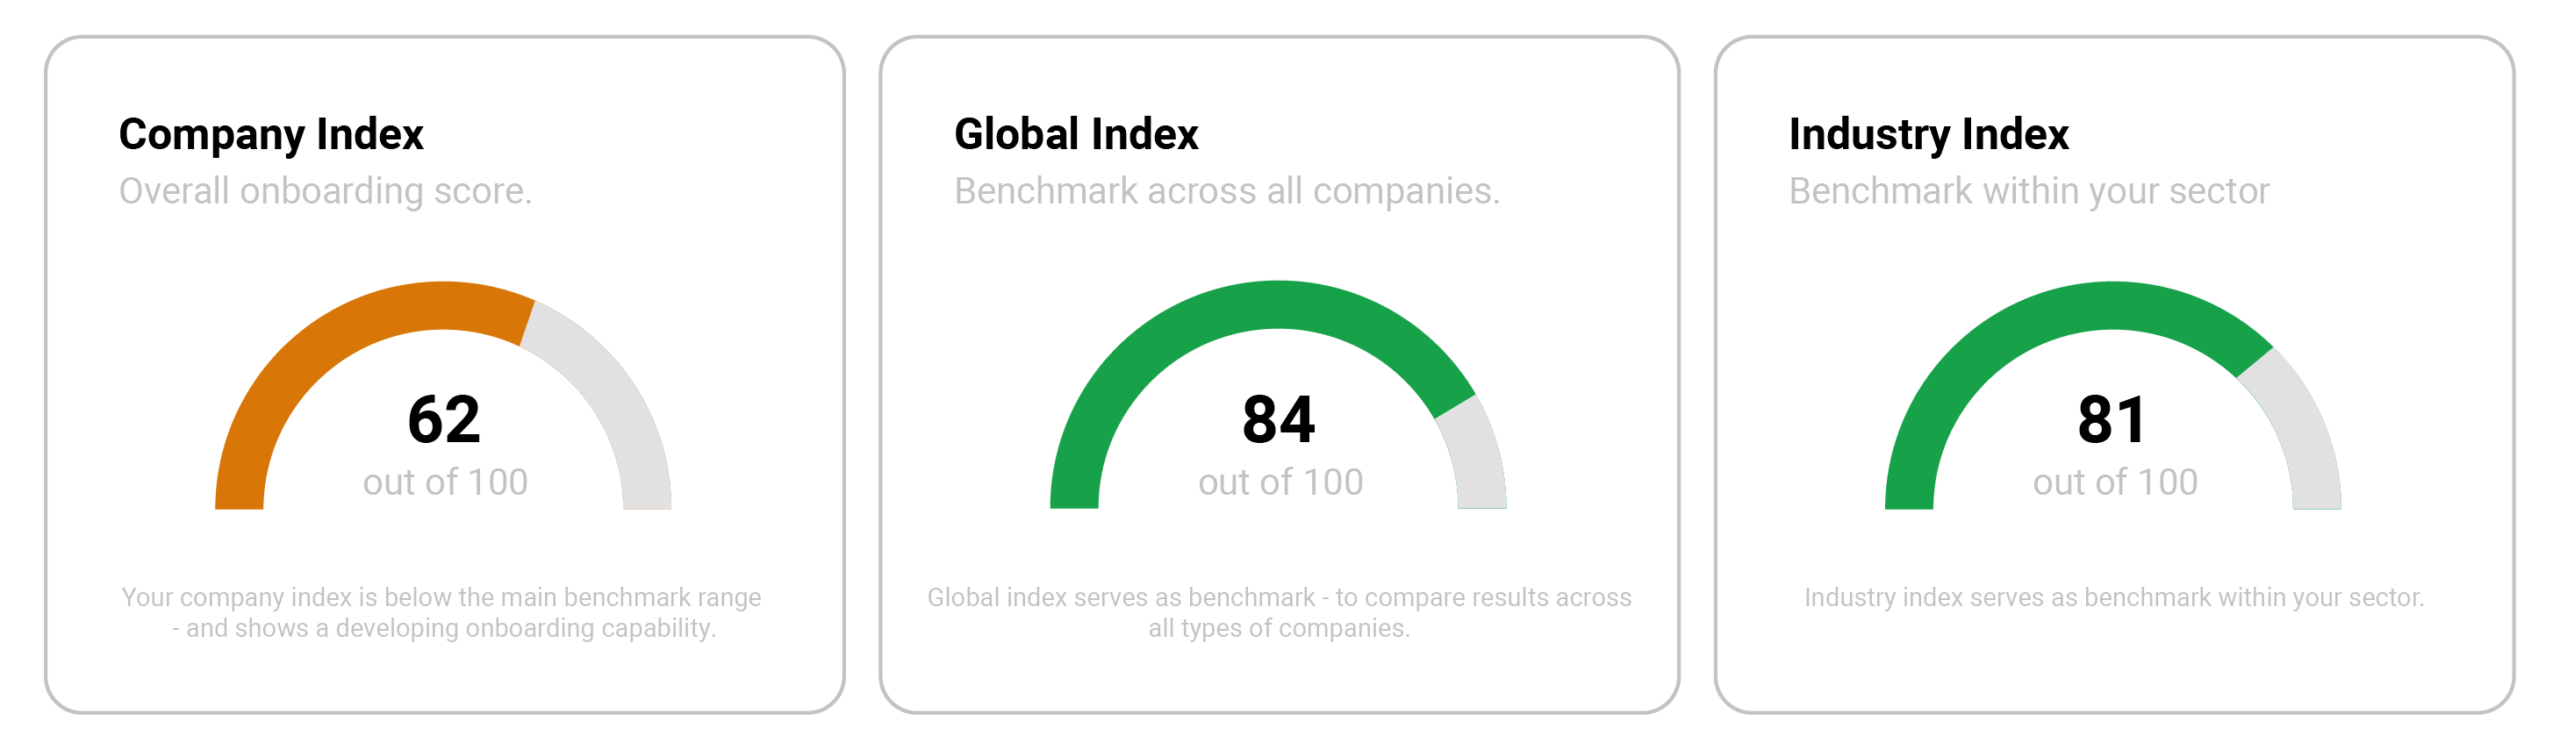
Example: The company’s index of 62 is compared against an industry benchmark of 81 and a global benchmark of 84.
INTERNAL
Teams and departments
Where in the organization does effort need to go?
INDUSTRY
Similar organizations
Is the challenge ours alone — or a condition of the industry?
MARKET
Across industries
How do we calibrate what “good” actually means?
You can benchmark at several levels at once. Internally, you can compare departments or teams against each other — is onboarding in sales as strong as in product development, or is there a systematic difference? Externally, you can compare yourself against other organizations in the same industry, because onboarding challenges in a manufacturing company rarely resemble those in a consulting firm. And you can compare yourself against a broader market average across industries, to get a sense of where you stand in the bigger picture.
The three forms of benchmarking answer different questions. Internal comparison shows where the organization’s effort needs to go. An industry comparison shows whether your challenges are specific to you or are a condition of the industry as a whole. Market comparison offers a broader calibration of what “good” actually means.
From numbers to insight
An index that rises or falls tells you one thing. An index that can be broken down — by dimension, by department, by industry — starts to tell a very different story: who’s struggling, why, and how that compares to others in the same situation.
THE CRUCIAL SHIFT
Move from a number that shows the trend, to insight into who’s struggling — and why.
Move from a number that shows the trend, to insight into who’s struggling — and why.
That’s where benchmarks become something more than numbers on a graph. That’s the subject of the next article in the series. Before continuing with the series, you can read more about FastTrack, an HR tool that gives you valuable data and insights into your onboarding processes. FastTrack is part of HR-ON Boarding+.
This is the fourth article in a series about measuring and improving onboarding.
About the author
- Christian Harpelund is a qualified organizational psychologist and works with HR-ON as an onboarding expert
- He is the author of “Onboarding: Getting New Hires off to a Flying Start” and has a new book coming soon, “Kunsten at onboarde en leder” (in Danish)
- He delivers courses and gives talks on onboarding and the organizational frameworks that support effective leadership
You might also like: 5 Tips for Employees and Managers: What Makes a Great Onboarding Program?
FAQ: How can an onboarding index be used to track and improve onboarding?
What is the difference between a dialogue report and an onboarding index?
A dialogue report shows the situation for one employee at one specific point in time. An onboarding index, on the other hand, brings together data from across employees, departments, and measurement points, enabling the organization to track its overall development over time.
Why does the index include both one combined index score and six dimension scores?
The combined index score provides a quick overview of whether onboarding is moving in the right direction overall. The six-dimensional scores show what is driving the trend and can reveal areas that are lagging, even when the combined result looks positive.
Why is onboarding measured after 1, 3, and 6 months?
The three measurement points enable tracking of development throughout the onboarding process. The measurement after one month provides an early read on the experience. After three months, you can see what is moving and what is standing still, and after six months, you can assess whether the effort has made a lasting difference.
How can the index be used to see whether onboarding initiatives are working?
By following the index over time, the organization can compare results before and after specific initiatives. For example, if a new mentoring program is introduced, changes in the relevant dimension scores can show whether the initiative has actually made a difference.