10 Human Resource KPIs for the Modern HR Department
You might already know some KPIs or track some of these in your HR department. But choosing the right HR KPIs is essential for documenting and monitoring the performance of your HR department and the entire organization’s performance.
There is a ton of great HR KPIs out there, but we recommend tracking the outlined ones we have listed below and working your way up to new ones that complement your unique organization.
Let us dive right into it.
What Are the Best HR Kpis?
Are you new to the whole KPI situation? Let us start by explaining what KPIs are.
KPI stands for “Key Performance Indicator.”
Companies often use them to show if they achieve their core business objectives. KPIs are measurable metrics that any department can adapt. Today, we will look at the HR KPIs.
The best HR KPIs is the one that helps explain and asses the work of your HR department.
Characteristics of Good HR KPIs
To better understand good HR KPIs, you must know what you want to achieve by implementing them. List three things that would be great to know. You could ask yourself: “Do the new employee benefits impact sick days?”.
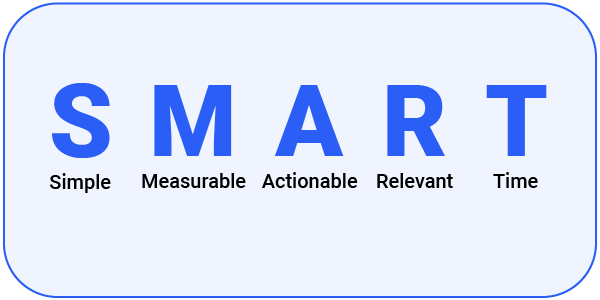
When you have found out, what you want to know by implementing HR KPIs, you should pick the KPIs that are simple, measurable, actionable, relevant, and time – Because these are the characteristics of a good HR KPI. Also known as SMART.
10 HR KPIs For the Modern HR Department
What are the 10 best HR KPIs to track in a modern HR department?
1. Employee Retention Rate
The employee retention rate is one of the most essential KPIs. It tracks how many employees choose to stay in your organization.
You can calculate it by:
Total number of employees at the end of a period / total number of employees at the beginning of a period x 100 = Employee retention rate
New hires are not included in the period you want to investigate.
2. Employee Engagement Index
Satisfaction and engagement among employees are crucial. But Employee Engagement Index can be measured in many ways depending on the needs within your organization.
We advise you to set up a survey and repeat that survey monthly, quarterly, or annually to keep track of the development.
3. Net Promoter Score
Are your employees ambassadors for your company, or are they just there for the paycheck? The Net Promoter Score is here to shed light on that.
One way to find the answer to the question is simply to ask your employees. “How likely is it that you would recommend your friend or family to work here?’’ or more straightforward: ‘’How would you rank the overall organization from 1 to 10?”
The ones saying 1 to 6 = Is a Detractor
The ones saying 7 to 10 = Promoters for the company
4. Absenteeism Rate
Loss in productivity is hard to avoid, but keeping track of it will be a good KPI to have in your toolbox. A high Absenteeism Rate is a red flag that you should take seriously. It could indicate lousy management, unpleasant work culture, burnout, or lack of motivation.
You can calculate the Absenteeism Rate by:
Total number of lost workdays due to absence – The number of available workdays in an organization x 100 = Absenteeism Rate in percentage
Do it for individual teams or entire organizations. You can also see differences in the different absence types.
5. Average Salary or Salary Competitiveness Ratio
The average salary within the company gives you a nice picture of the workforce and the expenses. But you can take it one step further and investigate what your competitors offer your employees.
In the offboarding interview, you can ask the employee what they were offered the new place. If they want to give you this information, you can compare and see where the organization lies if they provide the same position.
Another way is in the hiring interview, but they might need to be more fully transparent here.
6. Company Seniority
People have a shorter time period with companies in today’s world than 10 or 20 years ago. But calculating the average seniority might indicate the culture within different teams or prepare you for new hires and the cost.
If you have a short length of service, you have to prepare yourself for faster return on employees or look into the team to see why people are leaving fast.
7. Benefits Package Tracking
Benefits are not one size fits all, but tracking the package that you as a company provides is crucial. This KPI is more than just a number; it is a system to keep track of.
Tracking the company’s Benefits Package allows you to ensure that you provide the same package for everyone on the same level. In 2023 you want to ensure you give the same benefits based on skills and not gender.
A way to track this is by conducting a document where you list benefits at one employee level, on the c-level, and at the top management level.
8. 12-month Failure Rate
The 12-month Failure Rate is where you find out if something is wrong with your onboarding process or if the employees don’t fit the company culture. A high score could indicate just that – but with a good exit interview, you will know which one it is.
Calculate this KPI by:
The number of people who have quit in their first year / with the total recruitment number.
You might also know this one as the 90-day Failure Rate, but this will give you a partial picture. But it could be a metric you want to look into if you see a pattern.
9. Diversity Metrics
Diversity is essential in a company because it ensures a broader knowledge base. One thing is to provide enough women in leadership positions. Another factor is ensuring diverse ethnicity and many other factors.
You can calculate this in many ways. So we won’t look further into this. But set up some rules for where you want to go as a company. Is your company good at promoting women? You might want to look towards ensuring diversity in other areas; examples of this could be:
- Ensuring a good place for neurodiversity
- Ensuring a good work environment for disabilities
- Ensuring a safe place for all kinds of genders and sexualities
- Ensuring equal rights and opportunities for all the above
10. Workplace Accidents
Workplace Accidents are one of the biggest reasons for absenteeism. Keeping track of this will ensure that solutions are put into place before other gets hurt, or it leads to high cost, low productivity, and other problems.
Track this metric by looking at the different accidents over a given time. It can be everything from a frozen shoulder because of bad posture at the desk to fall accidents because of loose items.
How to Track HR KPIs
Tracking KPIs is vital to know if your organization is moving forward or backward. But how do you track those HR KPIs?
When implementing HR KPIs, you need a place to store them so that you can keep an eye on them. Let’s introduce HR-ON Staff.
HR-ON Staff is the place to find information and conduct surveys. Let us take a look at how HR-ON Staff can track your KPIs.
You can conduct all kinds of surveys via the feature we call “Engagement Builder,” such as:
- Employee Engagement Surveys
- Daily Pulse
- Internal Questionnaires
- Net Promoter Score
- Employee Satisfaction Index
- Well Being Surveys
- Employee Development Interview or in danish Medarbejderudviklingssamtale (MUS)
Other than that, you have all the information to track other KPIs such as the Diversity Metric, 12-month Failure Rate, and much more.
Manage Your HR KPIs on a Daily, Monthly, and Yearly Basis
When you have decided which KPIs you want to track, you have to decide how often you want to track them and update them. One way to keep track of your HR KPIs is via HR-ON Staff dashboard widgets.
The system is born with a few standard dashboards, but it is possible to add your own and customize the data.
Wanna know how HR-ON Staff can help you in your daily life – book your free clarification call today. It only takes 5 minutes to know if HR-ON is the right match for you.
